There are several ways to find meteorological data:
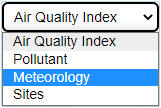
- To display only sites that include meteorological data collection, select Meteorology in the pulldown field in the top left under the blue menu bar. This control defaults to Air Quality Index (AQI) but offers meteorology and pollutant readings on the map.
- The map dots will change to blue; display the wind speed; and indicate wind direction.
- Select a site by clicking the site name in the list on the right of the main page, or click the dot over the site on the map. After you open the site data:
- Display only sites that include meteorological data collection by selecting Meteorology in the pulldown field in the top left under the blue menu bar. This control defaults to Air Quality Index (AQI) but offers meteorology and pollutant readings on the map. See FAQ #3 for information on the difference between AQI and pollutant readings.
- The map dots will change to blue; display the wind speed; and indicate wind direction.
- Select:
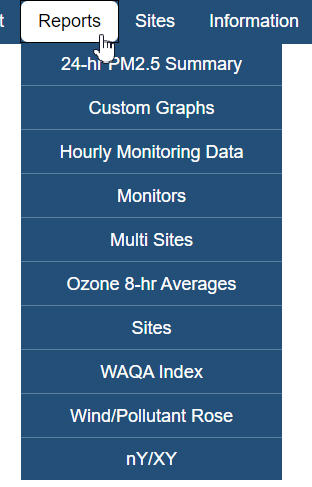
- Run reports from the reports menu.
- Monitor Report
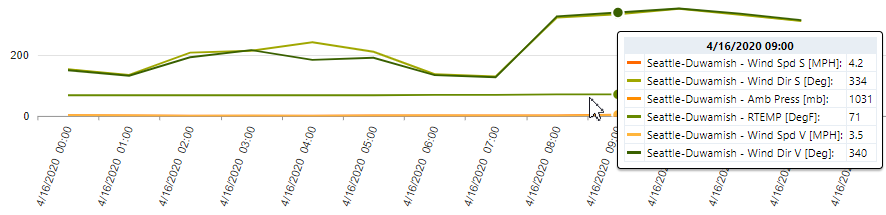
 or view Line Chart by clicking the line chart button
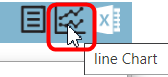
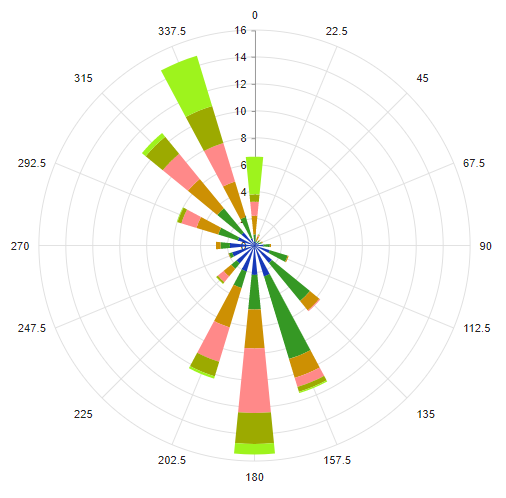
- Wind/Pollutant Rose
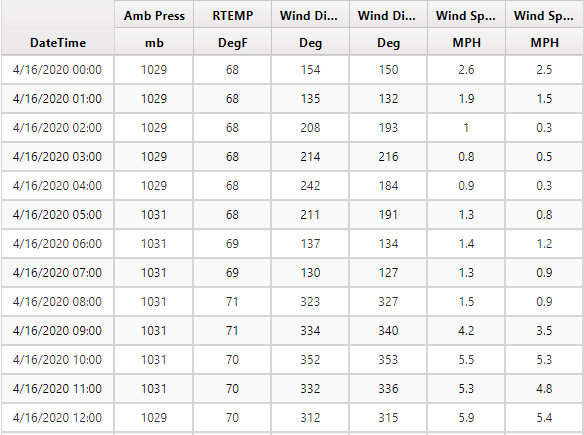
- Select the site, Wind Direction, Wind Speed
- Click the Wind/Pollutant Rose button at the top
- Click Graph
- Select the Time Base
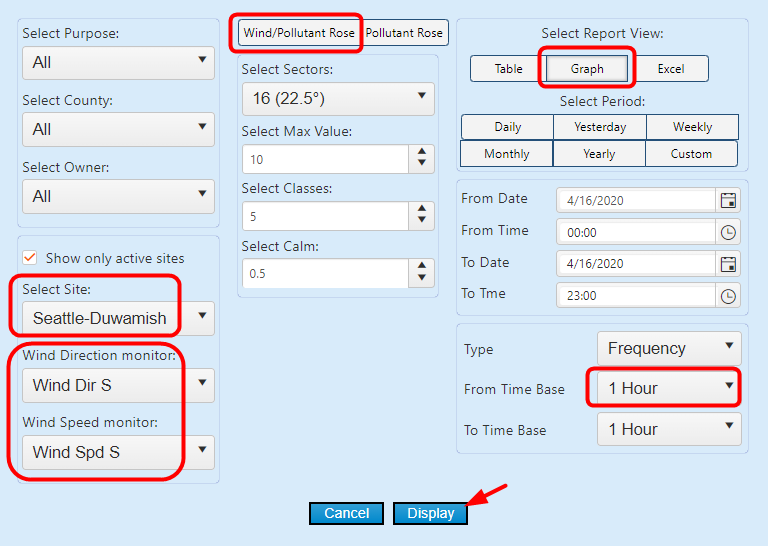
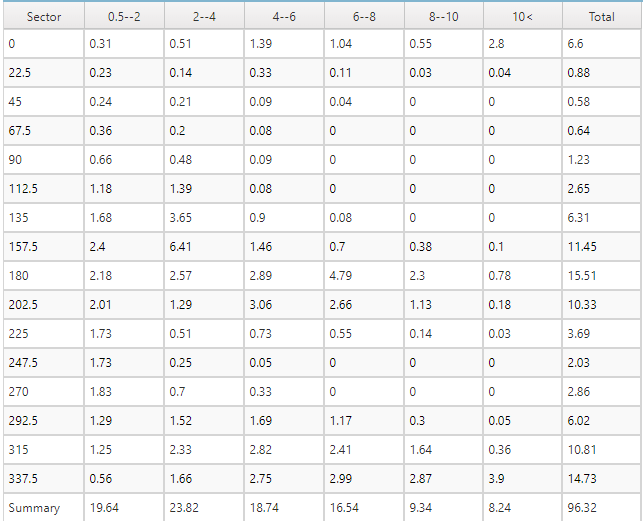
-
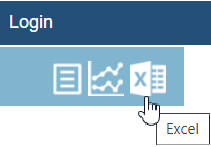
If you didn’t click "Graph" the data will be displayed in a table. To change to graph
click the chart button
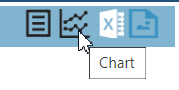 at the top. To go
to table data, click the table button
at the top. To go
to table data, click the table button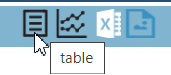 .
.
- Hourly Monitoring Data
- Data will automatically display for all sites.
- The date is defaulted to “today” but can be changed. Either scroll with the arrow buttons
 or click to select year,
month, and date from a calendar.
or click to select year,
month, and date from a calendar. - Select the site with the "Search Site"
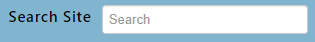 box
upper right and it will
start to display sites as you type.
box
upper right and it will
start to display sites as you type.